AI – Is it in a bubble and is today’s US stock market overvalued?

One question on many investors’ minds is around whether AI (artificial intelligence) is in a bubble and whether they should reduce their exposure to the US stock market.
A handful of firms including cloud providers, chipmakers, and specialised software platforms have captured outsized gains as markets have priced in large future productivity and revenue gains from generative AI (this is the branch of AI which is capable of creating original content such as text, images, video and audio in response to user prompts) and related technologies.
That concentration creates two distinct risks: a classic sector bubble (where prices outstrip plausible fundamentals for specific AI plays) and a broader market valuation premium driven by those few winners lifting headline indexes. According to Reuters, recent research and market surveys show investors are wary and the majority say that AI stocks feel bubbly.
Valuation readings for the U.S. market are unmistakably high by historical standards. The price/earnings ratio for US stocks, which is one measure of how expensive a stock market is sit well above long-run averages in the mid-teens. Historically, readings in this range have signalled much lower expected real returns over the next 10–20 years though they don’t tell you timing.
US Valuations and subsequent returns

Sources and disclaimers
Source: (All charts) IBES, LSEG Datastream, S&P Global, J.P. Morgan Asset Management. 2Dots represent monthly data points since 1988, which is earliest available. Forward P/E ratio is price to 12- month forward earnings, calculated using IBES earnings estimates. Past performance is not a reliable indicator for current and future results.
Guide to the Markets- UK. Data as of 30 September 2025.
But high headline valuations do not automatically mean the entire market is in a bubble. Firstly, valuation metrics are blunt tools: they average over thousands of companies and can be skewed by a small number of extremely high-priced names that dominate the market index. Second, if AI genuinely produces a step-change in productivity and corporate profit margins over the next decade, higher-than-historical multiples could be justified — at least for the winners. This explains part of the debate among investors as to whether we are seeing rational re-rating based on durable earnings upgrades, or irrational speculation in hopes of “getting in” on the next monopoly (1.).
In a recent Blackrock market update they acknowledged that technology and the AI theme has grown over the last decade from being 10% to some 35% of the US stock market composition. They highlighted that these businesses have grown profits by 8% per annum for the last ten years whilst the rest of the USA market businesses have only grown at 2% per year and that these superior earnings potentially justify these stocks being on such high valuations. (2.)
It is easy to get excited by the technology but signs that the current episode has bubble characteristics are present and material. Several large asset managers and market commentators point to a concentration effect: a small group of AI-ecosystem firms have accounted for a disproportionate share of recent index gains, making broad index returns look stronger than the underlying breadth of market strength. Morgan Stanley research and others highlight that AI-related segments have driven much of the US stock market’s excess performance, which raises the risk that a de-rating in that segment would trigger broader market weakness (3).
Investor sentiment and positioning amplify vulnerability. Surveys and fund manager polls in October 2025 show meaningful fractions of professionals flagging an “AI bubble.” (4.) When sentiment is elevated and flows pour into similar long-duration growth bets, even modest shocks such as slower AI monetisation, regulatory constraints, or an earnings miss at a big name can trigger rapid price moves as leverage and rebalancing forces an unwind.
What could pop an AI bubble? Several plausible triggers exist. Firstly, disappointment in revenues and margins — firms may take longer to build reliable, high-margin AI products than investors expect. Second, supply constraints and cost pressures such as for advanced chips or energy for data centres could compress margins. Third, regulatory or policy actions — on data use, competition, or export controls — could blunt the addressable market that many investors assume. Finally, tighter financial conditions including rising rates or a risk-off move could hit these stocks hardest.
Does “dangerously overvalued” mean an imminent crash? Not necessarily. Valuation is a measure of risk, not timing. Although expensive valuations can imply lower expected long-term returns and greater downside if expectations are unmet, markets can remain expensive for long periods. That said, the current combination — historically high aggregate valuation metrics, concentration in AI-linked winners, and stretched sentiment — increases the probability of a meaningful drawdown or poor relative performance compared to those markets with lower valuations or less exposure to AI stocks such as the UK stock market.
So, what is a pragmatic approach to dealing with this? Firstly, we suggest it is wise to recognize concentration risk. Diversification matters: owning the index may feel safe, but when a handful of names drive returns, active risk management with its ability to size positions, rebalance portfolios, or simply trimming winners reduces the exposure and potentially the risk.
Our fund managers do focus on valuations and cash flows of the companies they invest in. For individual names, they prioritise companies with credible, near-term paths to profit and strong free-cash-flow conversion rather than narratives alone.
Expect volatility. Elevated valuations and stock market concentration can amplify swings in share prices and produce wider drawdowns. Incorporating alternatives in your portfolios reduces the risks of drawdown and we include absolute return seeking managers in this segment of our portfolios as they can make money from rising and falling prices in shares or bonds markets.
Focus on the long term. The U.S. market is elevated by most historical valuation measures, and the AI narrative has created sector-bubble characteristics in parts of the market. But “dangerously overvalued” depends on your horizon and exposure. For a leveraged trader focused on short-term performance, current conditions are high risk. For a long-term investor who diversifies, emphasises cash flow, and avoids being overweight in the most speculative AI darlings, the environment is navigable and it’s best to assume higher volatility, lower expected returns, and to manage positioning accordingly.
We have long taken the view that it is best to take a diversified approach and avoid too much exposure to what has been an incredible US stock market over the last decade, instead investing across markets where there are cheaper valuations. We have also positioned away from AI stocks and have increased our exposure to Alternatives wherever portfolios allow in order to deal with the higher volatility that may arise over the coming months and years ahead.
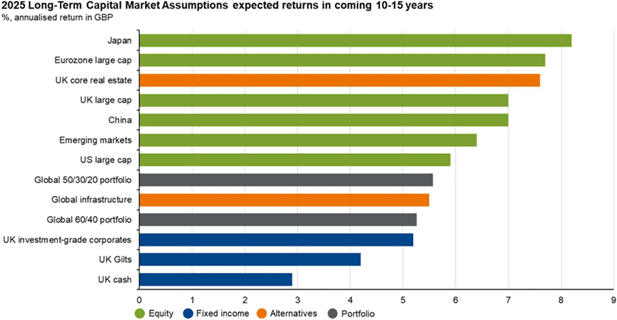
And before anyone panics, we must look at what the anticipated returns are for asset classes over the next 10-15 years when thinking about positioning. We include below the forecasts from JP Morgan which we use alongside those from Goldman Sachs and Towers Watson and these still suggest healthy returns from stock markets over the next 10-15 years.
Asset return expectations
Sources and disclaimers
Source: J.P. Morgan Asset Management Long-Term Capital Market Assumptions, J.P. Morgan Asset Management. Returns are nominal and in GBP. Global 60/40 potfolio is 60% MSCI ACWI Index and 40% global government bonds (hedged). Global 50/30/20 potfolio is 50% MSCI ACWI Index, 30% global government bonds (hedged), and 20% selected alternatives. The projections in the chat above are based on J.P. Morgan Asset Management’s proprietary Long-Term Capital Market Assumptions (10-15 years) for returns of major asset classes. The resulting projections include only the benchmark return associated with the potfolio and do not include alpha from the underlying product strategies within each asset class. The assumptions are presented for illustrative purposes only. Past peformance and forecasts are not reliable indicators of current and future results.
Guide to the Markets- UK. Data as of 30 September 2025.
Sources: 1 Schwab Brokerage 2 Blackrock 3 Morgan Stanley 4 Reuters